
4 Dec 2024
Post by Midwest Money Mentor
In the last post of this series, we went through some of the basics of the fees that have historically been charged by the Mutual Fund and Exchange Traded Fund world. That is, in conjunction with an example of a fee ratio charged by my prior employer sponsored retirement account manager and others.
The purpose of that post was to help you start understanding how easy it can be to be completely taken advantage of in the financial services world, and not even know it. Most fees are hidden, and the ones that are more visible often are presented as not a large amount.
The purpose of this post, is to present some charts and examples for you to visually see how dramatically your costs can change depending on the set up you agree to for your investment accounts.
Lets start by jumping back into some of the terminology I used in the last post. In particular, I gave an example of paying an “Expense Ratio” to an “Actively Managed Mutual Fund”, and paying a percentage fee, also called a “Assets Under Management Fee” to a Financial Advisor. Lets break these out a little more to make sure each of these terms makes sense.
- Expense Ratio – I mentioned this in the last post, but an expense ratio is a percentage fee that is paid to the mutual fund company for the management and administration of the fund. This fee is shown as a percentage of the assets you have invested. The percentage can be as low as 0.00 and as high as someone is willing to pay (it is unlikely to see expense ratios above 3%). Mutual Funds and Exchange Traded Funds can charge more fees than just this Expense Ratio, but this cost is the most widely seen and known of the fees, which is why it is emphasized a little more in these posts. Mentally, just know that you are paying more fees than just this Expense Ratio within the funds you are invested in.
- Actively Managed Mutual Fund – When it comes to the Mutual Fund and ETF world, a common way to separate out types of funds is by their cost and management approach. Funds can be differentiated by whether they are actively or passively managed funds. Actively managed funds are funds that have fund managers actively trading (or buying and selling bonds or stocks) within the fund in order to try to beat the average market returns of an index (which is a series of stocks or bonds similar to the fund design). If the fund was passively managed, then the fund’s goal would be to mimic the performance of the index instead of trying to beat the index. The Actively Managed funds traditionally charge higher fees for their efforts to attempt to surpass the returns of the passively managed funds and indexes.
- Assets Under Management Fee (AUM) – is a fee charged by certain Financial Advisors in certain contractual scenarios with their clients. In essence, it works the same as the Expense Ratio of a Mutual Fund or ETF, in which the advisor charges a percentage fee of the amount of assets they manage for you. This again, is not the only option for charging fees within the tools a Financial Advisor has available. It is an easy to calculate cost when talking about Expense Ratios at the same time, but know your advisor may be charging you commissioned sales loads, adding on redemption fees (most common in annuities), or may also just be charging flat fees or hourly rates, depending on circumstances.
In talking about these different fees, the point of this post is to help you understand the lower the fees, often the better your overall performance will be over the long-term. There are two aspects to cover with this conversation:
- Historically, how well do actively managed funds perform in regards to beating the index they are working to beat (and therefore, also beating the performance of the passively managed funds)?
- How much do the fees you pay for, with any funds, actively or passively managed, add up to when comparing the different percentages charged to you.
PERFORMANCE –
Lets start with the first aspect above, how well do actively managed funds perform against passively managed funds and the index they track? I’m going to keep this super short. First, lets review a quick chart of the goals and strategies of passively managed funds vs actively managed funds again for you to visualize (index funds are passively managed, below).

This chart is kindly displayed by Vanguard1 on their website. I thought it did a nice job of creating the comparison for a nice breakout of the differences.
So then, how do the two (passive and active) compare in their historical performance? Let us jump back to Vanguard to answer that question as well (I need to point out that I do no see this information on their website any longer, now that they seem to be pushing actively managed funds more than they previously did. Is Vanguard selling out and going the way of The Man?).
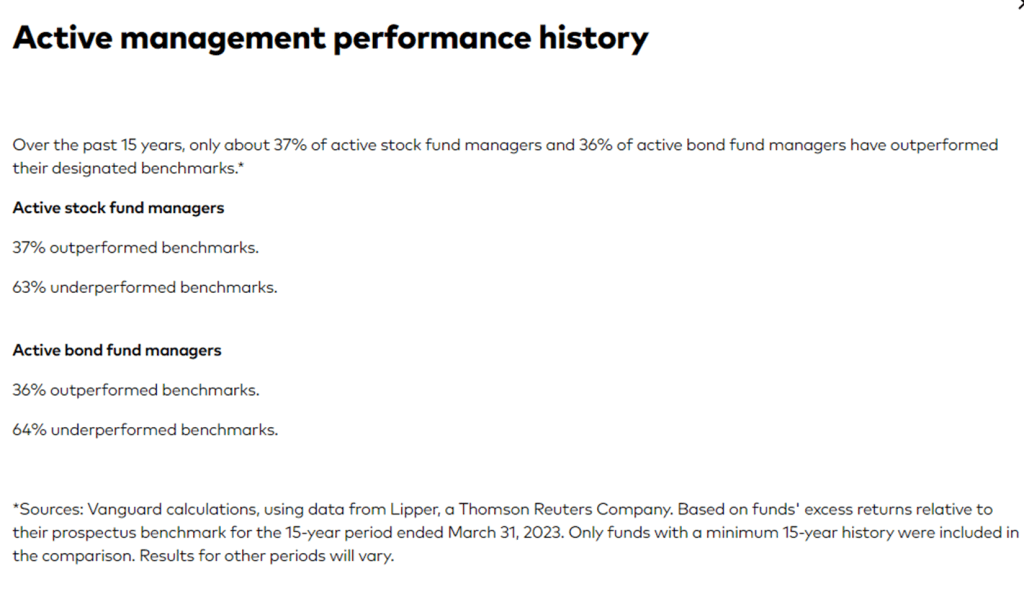
In case some of these words don’t make exact sense, what this previous page on Vanguard is stating is that of all the actively managed funds studied out there, only around 37% of those funds actually beat the index they were trying to beat (that you are paying them extra money to beat). Technically that is better than the pretty much 0% of passively managed funds that beat their benchmark. But again, passively managed funds are not supposed to beat their index benchmarks, they are just supposed to duplicate the index’s performance.
So, therefore, around 63% of the time, the passively managed funds beat out the actively managed funds when compared head to head.
I don’t know about you but I’d prefer to take the 63% likelihood of better performance over the 37% likelihood of better performance, especially when I have to pay more to only have the 37% chance of beating the index benchmark.
One Point to the Passively managed funds.
HOW MUCH DO COSTS ADD UP TO?
On to the second aspect of this post, how much do those costs actually add up to for you over time?
Using a friendly online fee calculator (which I will put the link to in the bottom of this post)2, we can calculate out examples to show you how crazy these costs are in ruining your retirement future.
First, let’s show an example of the costs you would pay if you purchased a passive mutual fund that charged an expense ratio of .20%. With this passive fund, there is no sales load or redemption fee, no 12b-1 fees, etc. Just a .20% expense ratio.
If you invested $100,000 in a fund of this fee set up and left it invested for 25 years, while getting a 7.25% average return, you would have over $547,000 at the end of the 25 years.

You can also see that in this example, you would have total fees add up to over $28,000 during that 25 year period. This is not a lot of fees, but still worth noting how much that adds up to.
But, what if we used the same scenario and changed two things:
- I changed the fee structure to an example of paying a total of 1.45% in expenses (via an expense ratio), which could just be the expense ratio of an actively managed fund, or it could be an actively managed fund and an Asset Under Management Fee of an advisor, combined. Or whatever. Either way, a total of 1.45% expense ratio.
- I changed the return in this next scenario to an 8% average return. Yes, most of the time studies show that actively managed funds do not outperform passively managed funds (or at least the index they track), but lets pretend you found one of the actively managed funds that did outperform their index. Let’s look at how much you have in this investment account after 25 years with the higher returning fund.

I HOPE YOU NOTICE TWO THINGS!
First, did you look at the ending balance of the account? This example is showing a higher return than the example above, while investing the same amount over the same number of years. But the ending balance here is only a little above $475,000 instead of the little over $547,000 in the first example. How do you get better returns but have less money in the end? The answer is, of course, because you paid more in fees.
Second, even though you got a higher return in this second example, the total cost of the fees you paid at the 1.45% fee ratio (total) add up to OVER TWO HUNDRED THOUSAND DOLLARS!!!!!!!!!! That is over 700% more in fees paid during the same time frame.
For the love of all that is good in this world, please tell me your eyes are super wide right now? The second example lost over 30% of their returns to fees. You tell me, what matters more, your returns or your costs? The answer is it depends, but if you can lower your costs you can sure give yourself a higher likelihood of better final returns.
If you have not done so recently, please make sure you go through all the investments you have in your 401k, IRA, brokerage account, and so on and check to see what fees you are paying. If they are high, please think about changing up what funds you are using. If you do not know where to look, feel free to use my blog post on buying low cost funds on Fidelity, or feel free to reach out to me for coaching.
Want to save yourself hundreds of thousands of dollars, I just showed you how. You are freaking welcome.
Also, for something completely unrelated to this post, enjoy one of the “Best Science Images” of 2024 –


0 Comments